
Katrangan
Debug Log Manager Tool is a debug log viewer and WP_DEBUG manager for WordPress. Read, search, group, and clear wp-content/debug.log from inside wp-admin; toggle WP_DEBUG, WP_DEBUG_LOG, WP_DEBUG_DISPLAY, SCRIPT_DEBUG, and SAVEQUERIES from explicit UI controls instead of editing wp-config.php; capture the last fatal error during shutdown; and review slow database queries with their stack trace. Useful as a lightweight alternative to Query Monitor or Debug Bar when you mainly need a clean debug.log reader and explicit debug-constant control.
The plugin focuses on safe first-run behavior: activation does not automatically turn debug mode on, deactivation does not automatically turn it off, and existing debug constants or custom log paths are preserved until you choose to change them.
Use it to inspect the current debug log, search and group log entries, copy useful error details, and make explicit debug configuration changes from the WordPress admin when needed. Advanced tools such as terminal commands, database inspection, Safe Mode, and notifications are available as optional helpers.
Quick Demo
Key Features
- Safe First Run: Activating the plugin does not automatically change WP_DEBUG, WP_DEBUG_LOG, WP_DEBUG_DISPLAY, SCRIPT_DEBUG, SAVEQUERIES, or existing log paths.
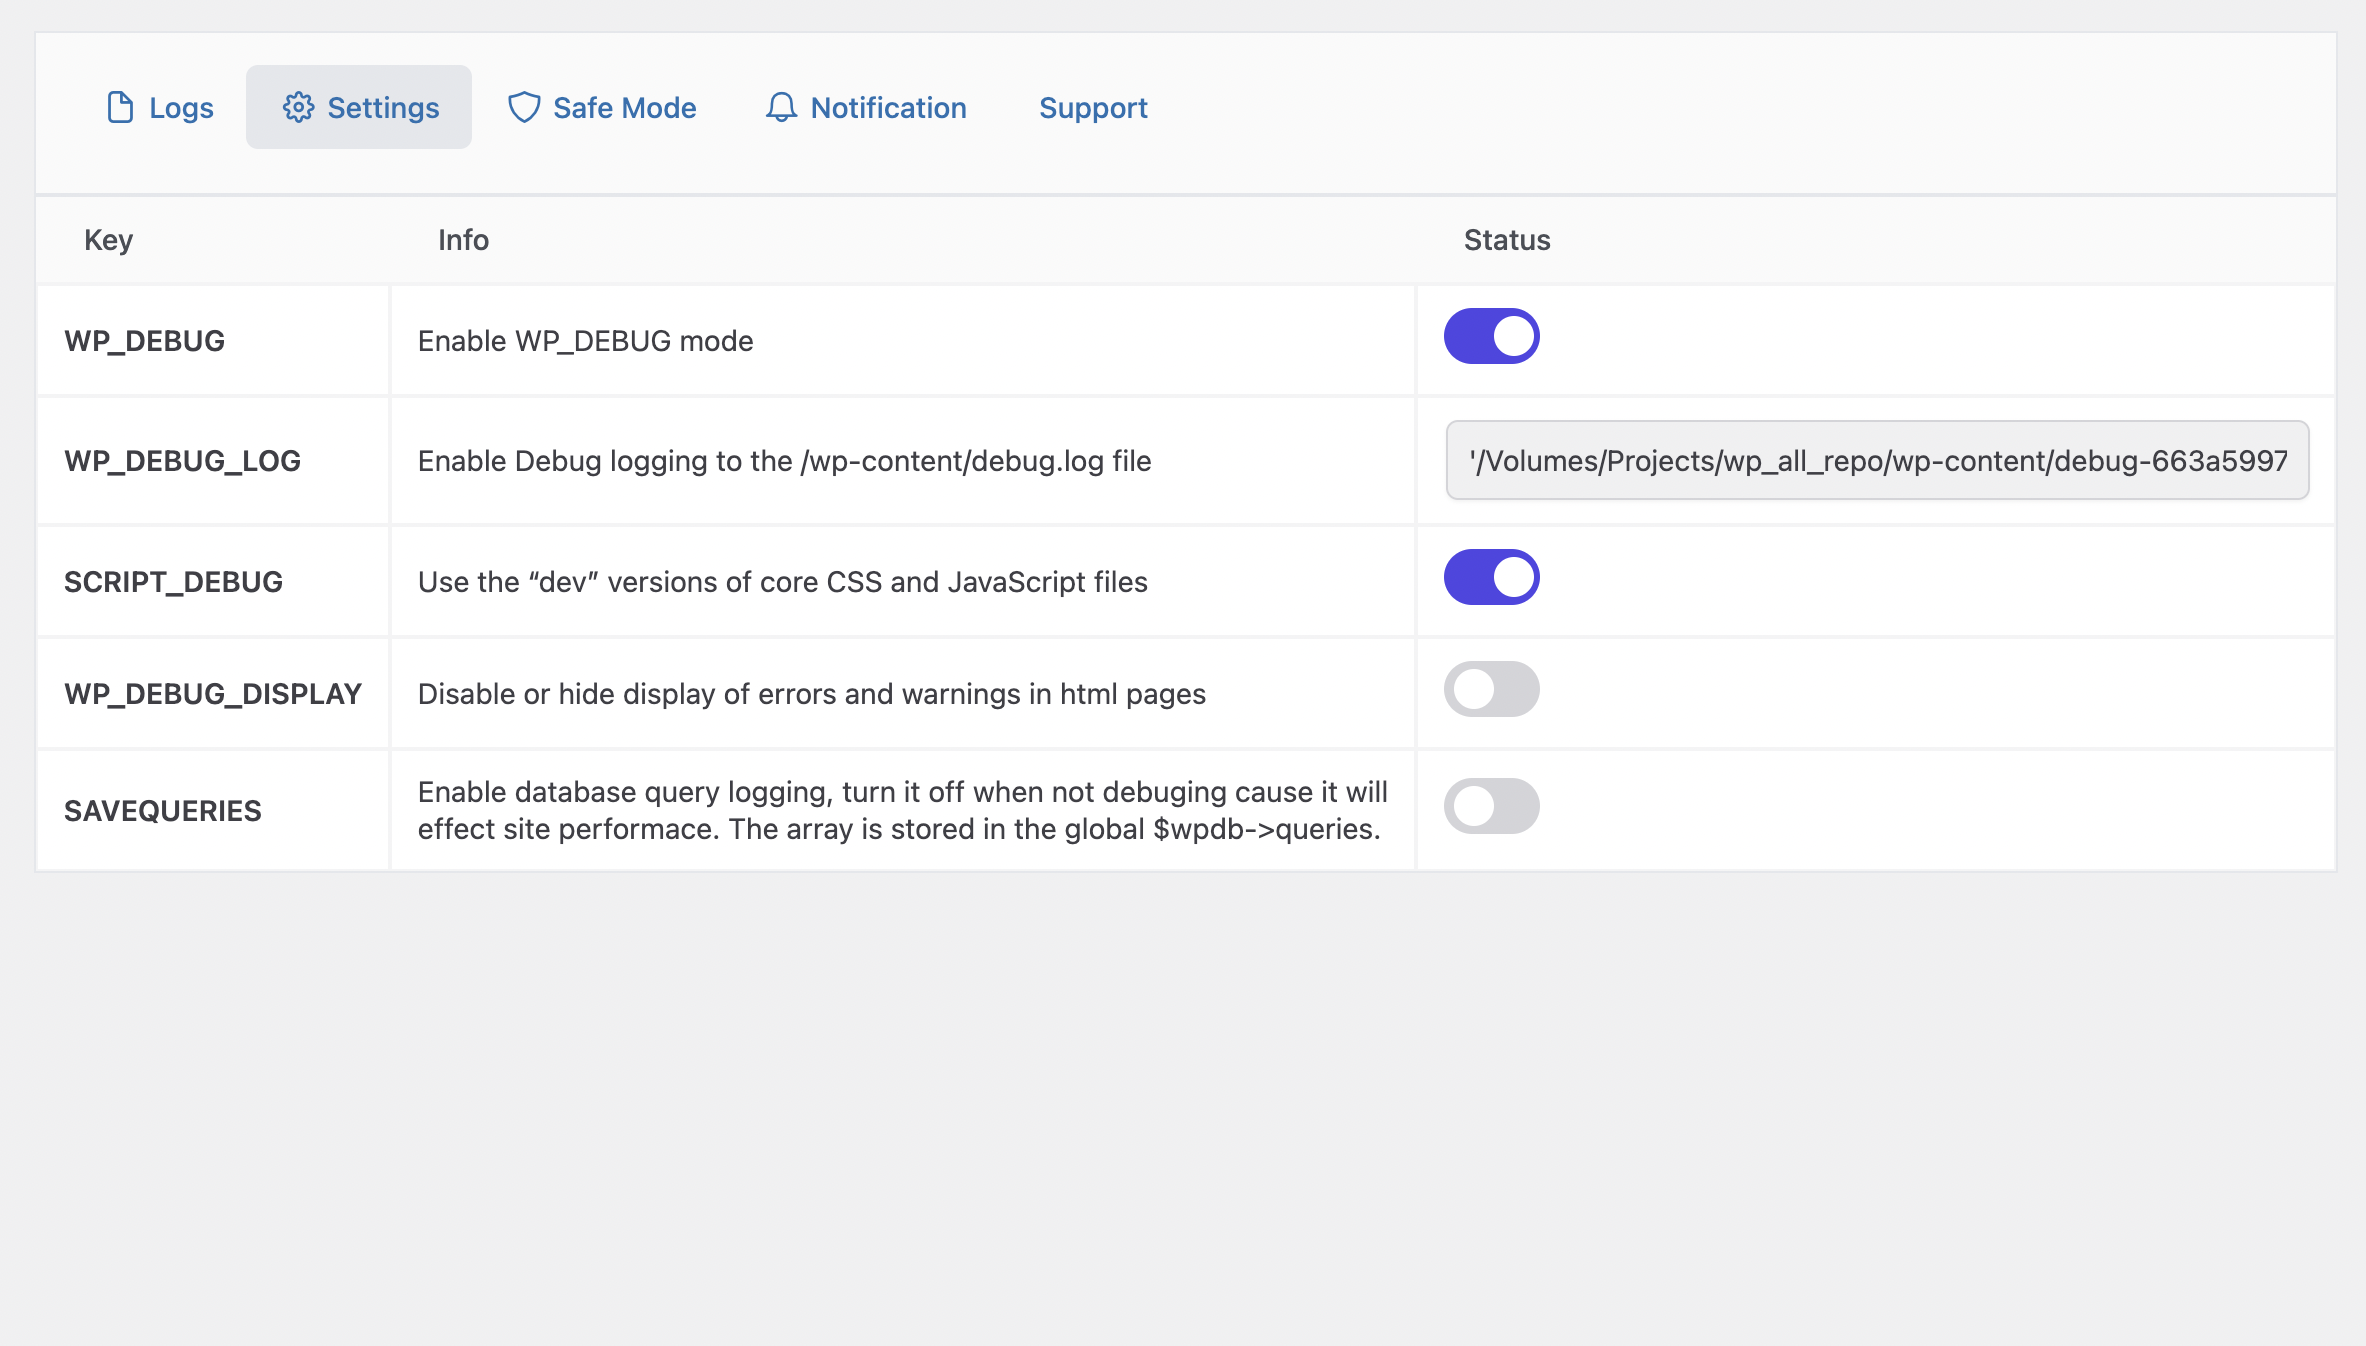
- Explicit Debug Controls: Review current debug constant values and update them only through intentional UI actions.
- Modern Debug Log Viewer: View, search, filter, group, copy, and clear debug log entries from a compact WordPress admin interface.
- Readable Timeline Rows: Scan log entries with severity labels, occurrence counts, plugin/source hints, exact timestamps, and copy-as-JSON actions.
- Stack Trace Analysis: Format PHP stack traces and database call chains so long fatal errors are easier to read.
- Last Fatal Snapshot: Capture the latest fatal error during shutdown and show it in the log screen when wp-admin is available again.
- Large Log File Preview: Open the current debug log file inside a modal and safely read the latest 1 MB of large files.
- Smooth Upgrade Behavior: Upgrades preserve existing constants and custom debug log locations instead of replacing your current configuration.
- Query Inspector: Optionally examine database queries when SAVEQUERIES is enabled, including SQL, caller, execution time, and stack trace details.
- WP-CLI Style Terminal: Optionally run guarded WordPress-style commands directly from the browser with command history and auto-completion.
- Terminal Settings: Enable or disable terminal access and database commands from a dedicated settings screen.
- Safe Mode: Optionally isolate plugin conflicts by keeping selected plugins active and restoring the previous state when Safe Mode is turned off.
- Email Notifications: Optionally configure notification email settings, daily summaries, and test email delivery for debug activity.
- Admin Bar Debug Toggle: Quickly review and change WP_DEBUG from the WordPress admin bar when you explicitly choose to.
- Dashboard Widget: See recent debug log activity from the WordPress dashboard.
- Custom Log Path Support: Keep existing custom log paths and use filters to customize the debug log location.
- Hardened Admin Routes: AJAX actions use nonce and capability checks, with guarded file path handling for debug log access.
Debug Constants Available
These constants can be reviewed and changed from the plugin UI. The plugin does not change them on activation or deactivation.
- WP_DEBUG – Enables WordPress debug mode
- WP_DEBUG_LOG – Saves errors to the configured debug log destination
- SCRIPT_DEBUG – Uses development versions of core JS and CSS files
- WP_DEBUG_DISPLAY – Controls whether debug messages display on screen
- SAVEQUERIES – Saves database queries for analysis
Developer Tools
- Terminal Commands: Optionally use WP-CLI style commands like
wp core versionorwp plugin list - Database Explorer: Optionally run SELECT queries and view results in a formatted table
- Stack Trace Analysis: Visualize error stack traces for easier debugging
- Hook Inspector: View all registered hooks and their callbacks
- Environment Detection: Development features are automatically hidden in production
- Copy JSON: Copy structured log entries for support tickets or developer handoff
- File Viewer: Inspect the debug log file without leaving the WordPress admin screen
Developer API: Use filters like
wp_dlct_log_file_pathanddlct_debug_file_pathto customize log path behavior.
Please note: Configuration changes are made only by explicit UI actions. Deactivating the plugin does not automatically restore, remove, enable, or disable WordPress debug constants.
Gambar conto
Debug log timeline with filters, grouped events, and file tools 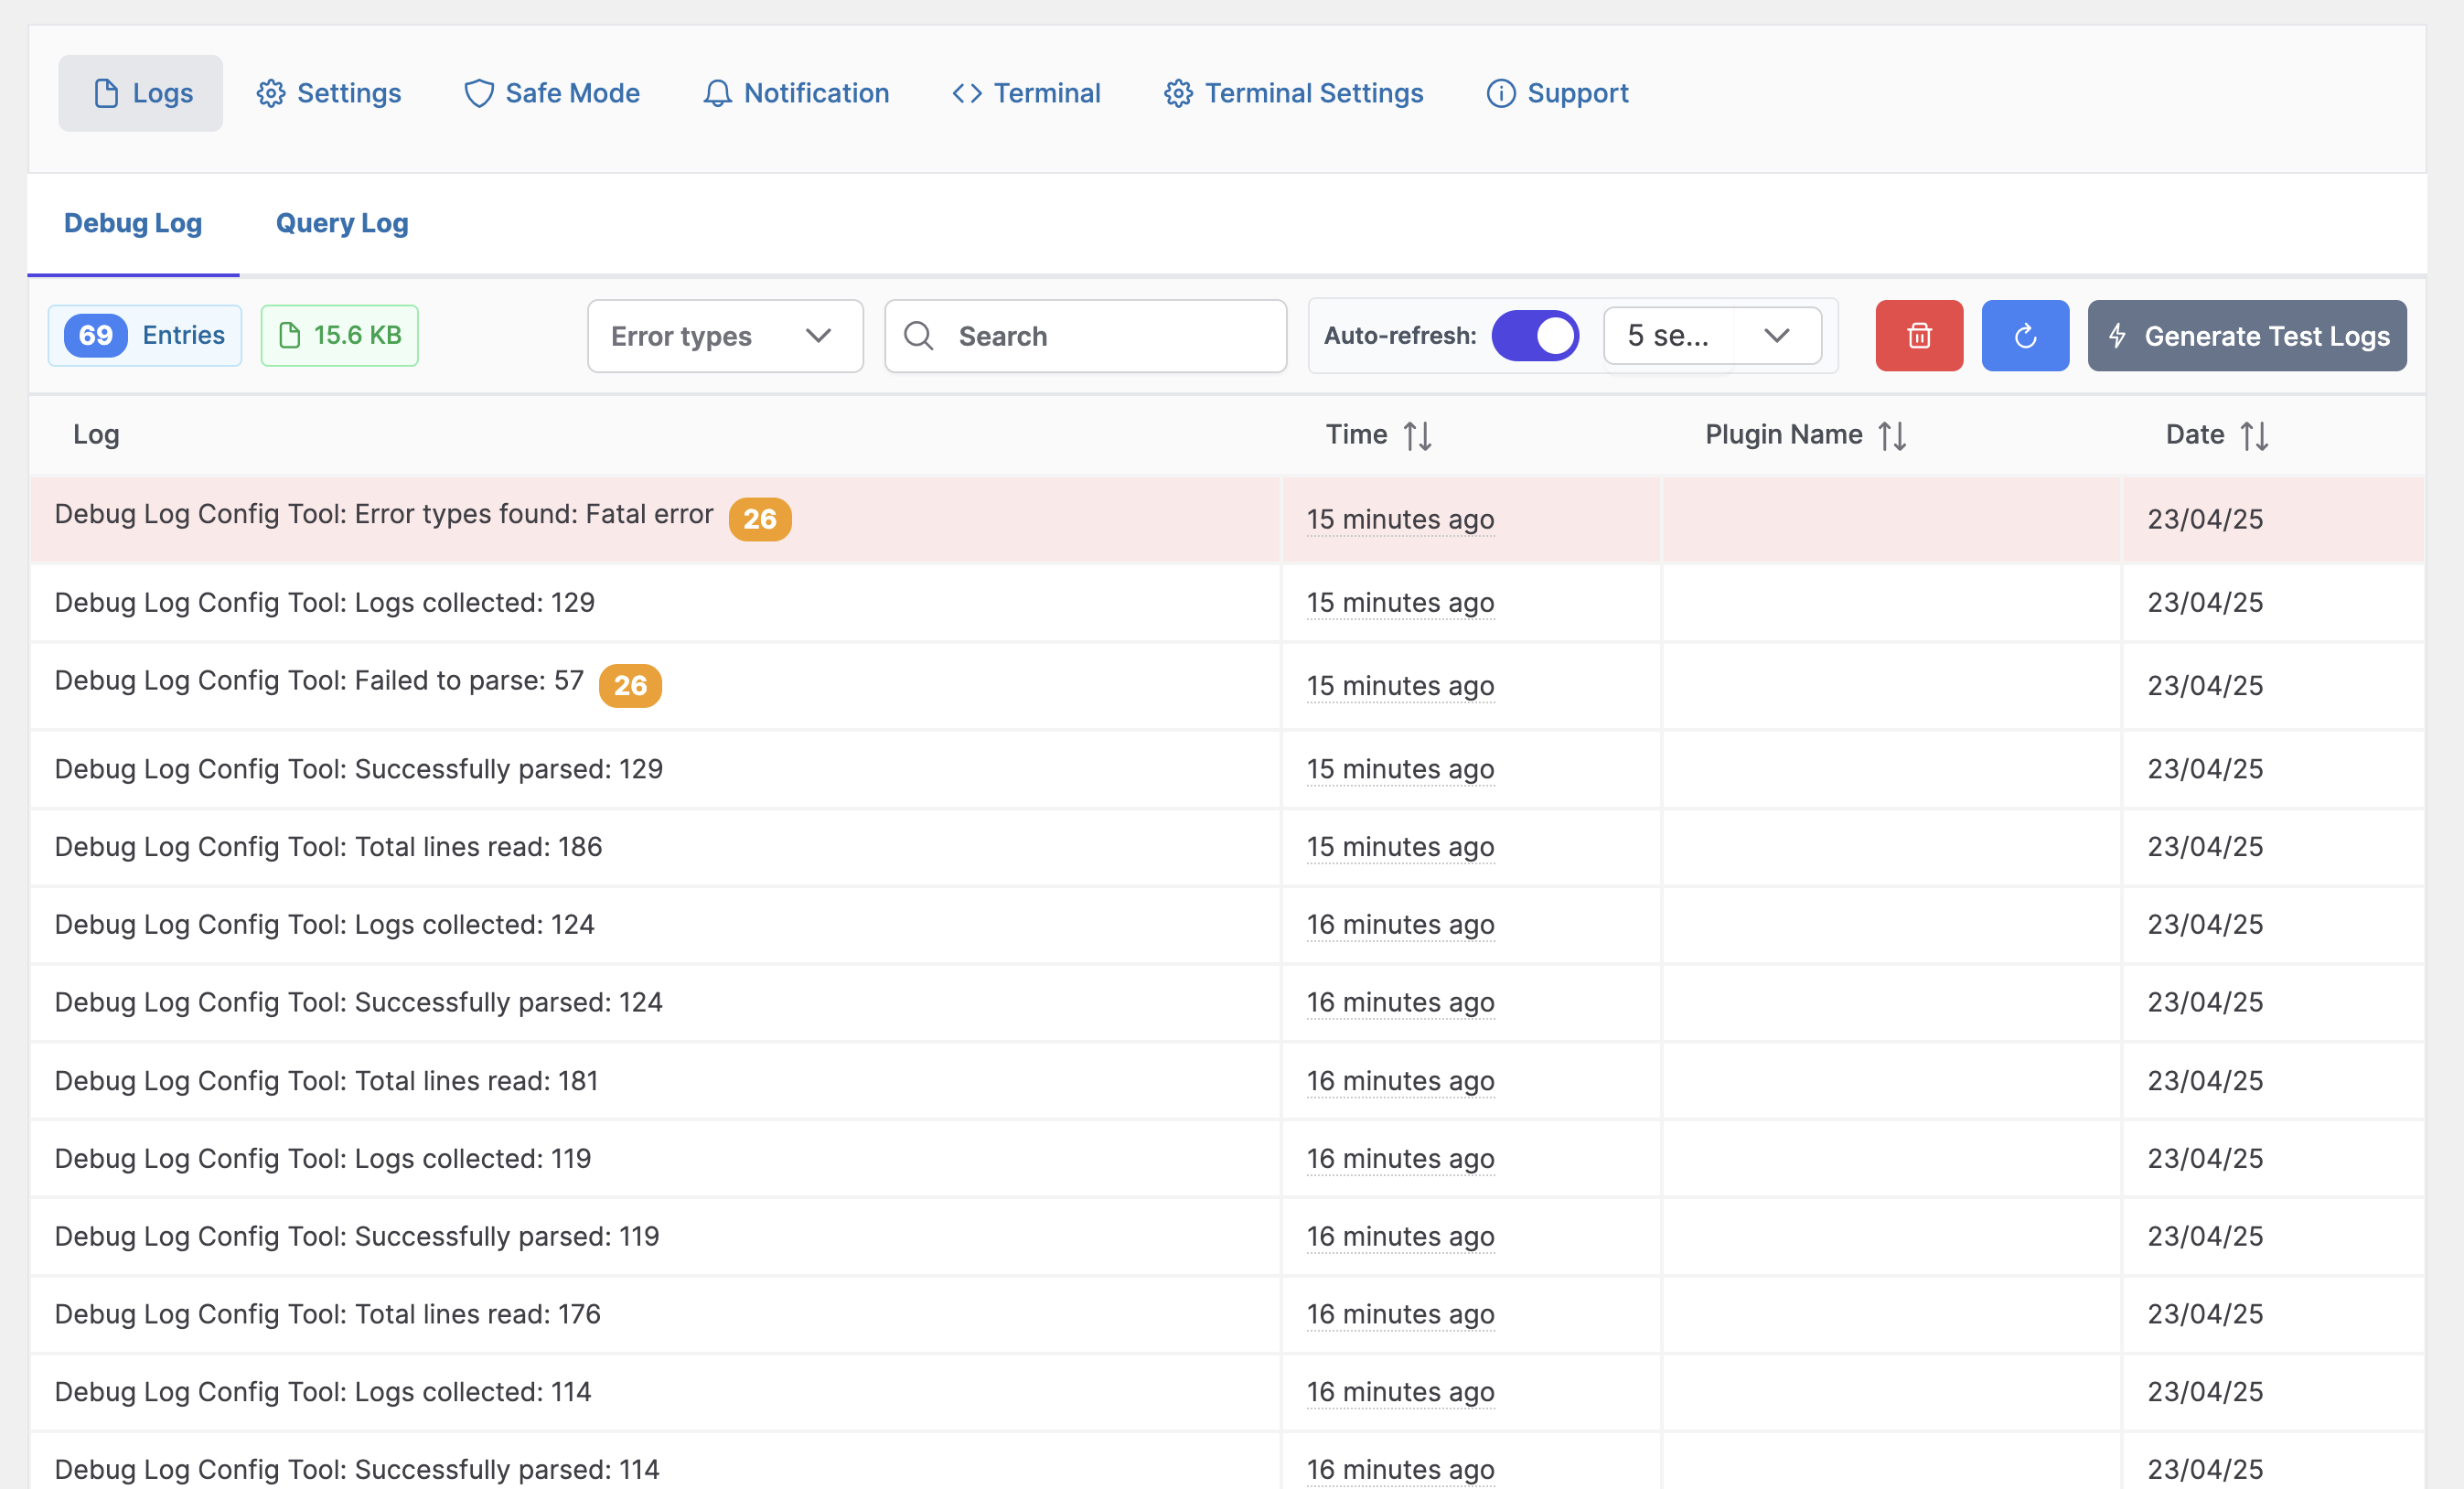
Terminal and database debugging commands 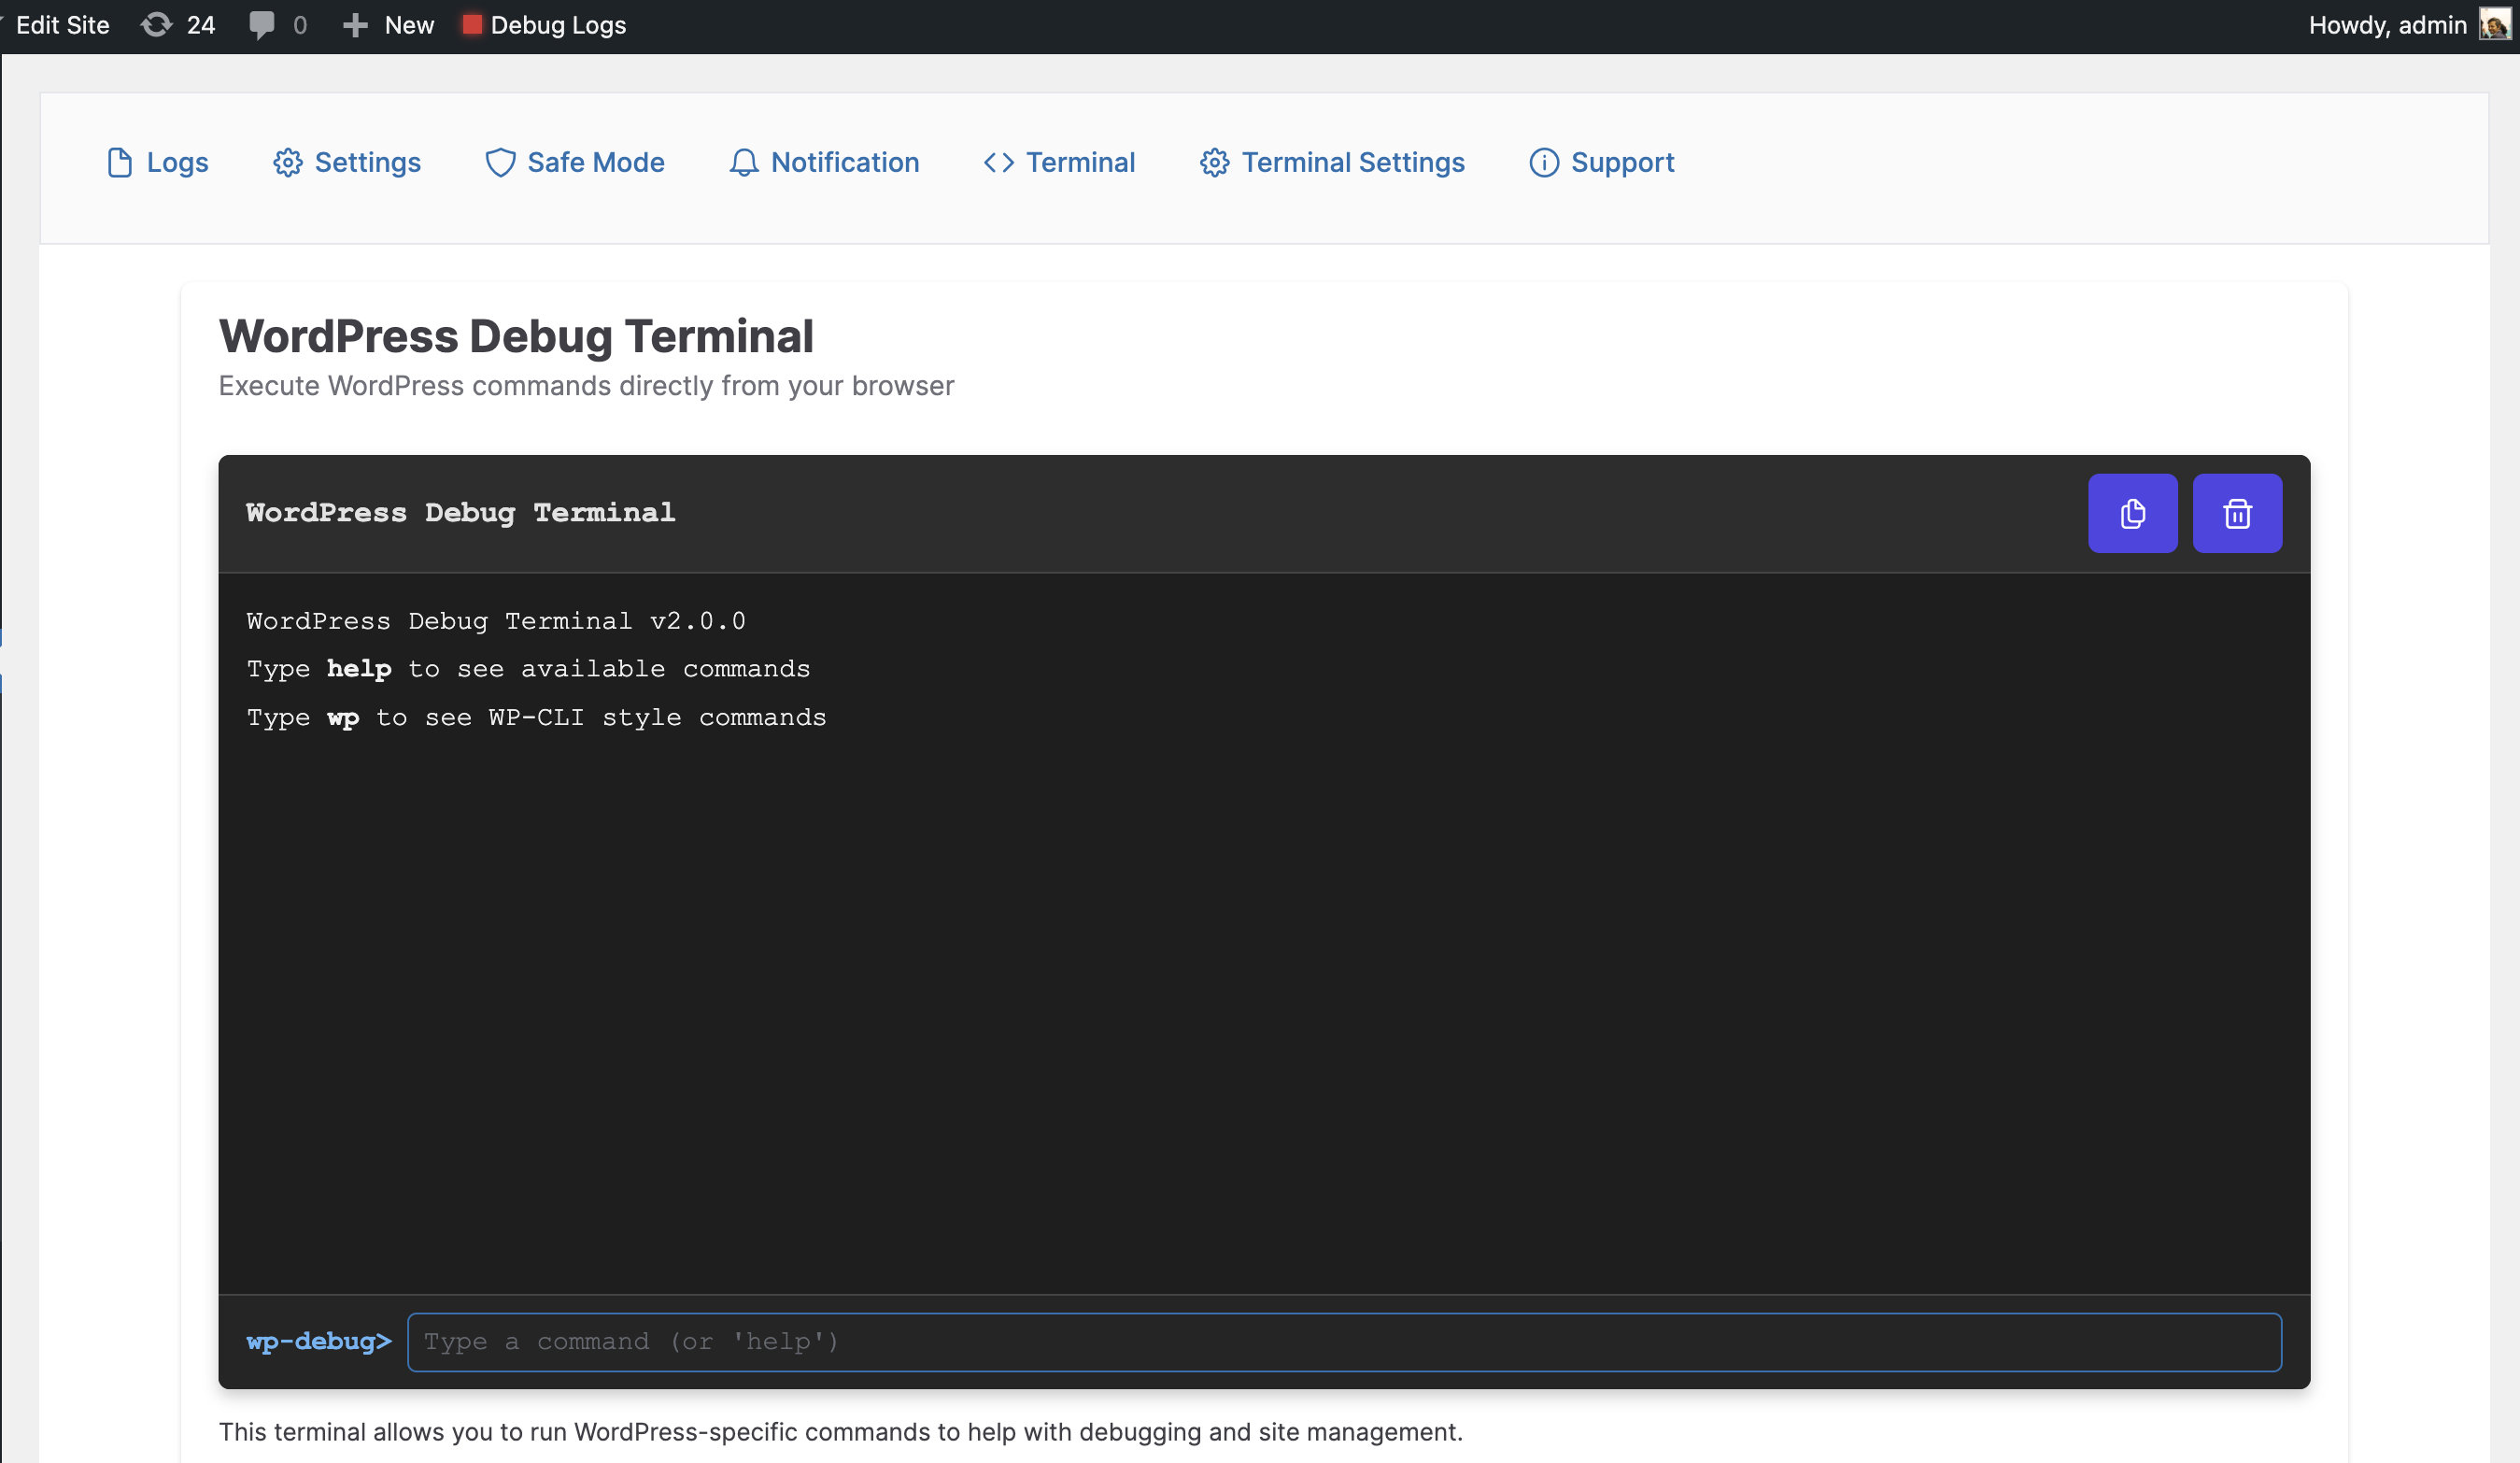
Safe Mode and settings screens
Pemasangan
- Upload the plugin files to the
/wp-content/plugins/debug-log-config-tooldirectory, or install the plugin through the WordPress plugins screen directly. - Activate the plugin through the ‘Plugins’ screen in WordPress. Activation will not automatically change your debug constants.
- Go to Tools -> Debug Logs to view logs, review current debug settings, or make an explicit configuration change.
FAQ
-
Do I need file manager/FTP or modify wp-config.php?
-
No. You can review current debug settings and turn debug constants on or off from the plugin settings when you choose to. Activation itself does not edit your debug configuration.
-
Will activation or deactivation change my debug constants?
-
No. Activation and deactivation do not automatically change WP_DEBUG, WP_DEBUG_LOG, WP_DEBUG_DISPLAY, SCRIPT_DEBUG, SAVEQUERIES, or your configured debug log path.
-
What happens when I upgrade from an older version?
-
The plugin preserves your existing debug constants and log path. Upgrade handling is designed to avoid replacing your current configuration unless you make an explicit change in the UI.
-
Are terminal commands and database tools required?
-
No. The core value is log viewing and debug configuration management. Terminal, database, Safe Mode, and notification tools are optional advanced features.
-
Can it help after a fatal error?
-
Yes. The plugin stores a small last-fatal-error snapshot during WordPress shutdown and shows it in the log screen when the dashboard can load again. It does not create a public emergency log viewer.
-
Can I see full debug in dashboard?
-
Yes you can see a simple log in dashboard widget and nicely formatted view in the plugin
-
What does safe mode do?
-
Safe mode will deactivate all the plugin except the selected one. When you turn safe mode off it will restore all the previous activated plugin.
Mācā ulang


Contributors & Developers
“Debug Log Manager Tool” is open source software. The following people have contributed to this plugin.
Kontributor
Translate “Debug Log Manager Tool” into your language.
Interested in development?
Browse the code, check out the SVN repository, or subscribe to the development log by RSS.
Caathetan Owahan
3.0.6
- Fixed: AJAX requests for removed or unknown actions no longer surface as a critical PHP error in wp-admin. The router now returns a JSON 404 and logs the attempt instead of throwing an uncaught exception.
- Fixed: admin-bar debug toggle script and styles are no longer injected on admin screens where the toggle is not rendered (AJAX, REST, cron, network admin, or for users without the required capability), resolving Vue 2 conflicts on JetEngine and Crocoblock editor screens.
- Improved: WP.org readme metadata — bumped Tested up to 7.0, Requires at least 6.0, Requires PHP 7.4, and refreshed tags and description copy for clearer search discoverability.
- Improved: synced plugin header (Requires at least, Requires PHP, Tested up to) so the in-WordPress plugin updater agrees with the readme.
3.0.5
- Added last fatal error snapshots so the log screen can show the most recent fatal captured during shutdown.
- Added read-only terminal commands for inspecting options, posts, users, and metadata without arbitrary PHP execution.
- Improved Query Log so missing or unchanged debug log files no longer hide collected database queries.
- Improved Query Log sorting and labels to show the most expensive queries first with execution time, duplicate count, and duplicate total time.
- Hardened first-run and upgrade behavior so activation, deactivation, settings reads, and log reads do not silently change debug constants or create a new debug log path.
- Defaulted terminal access to disabled for fresh installs while preserving saved terminal settings.
- Refreshed README and WordPress.org copy around safe first-run log management and optional advanced tools.
3.0.4
- Refreshed the plugin directory banner and icon with a softer visual style.
3.0.3
- Refreshed plugin directory assets and feature documentation.
3.0.2
- Improved debug log time labels so older entries show exact dates instead of misleading relative age text.
- Normalized the plugin name spelling on public plugin metadata.
3.0.1
- Maintenance release with refreshed plugin metadata.
3.0.0
- Hardened AJAX route verification to fail closed for invalid requests, missing permissions, and bad nonces.
- Added a guarded debug log file viewer endpoint with wp-content path containment and latest 1 MB reads for large files.
- Improved debug log migration safety by checking file containment, readability, and writability without overwriting the original default log.
- Reworked the admin interface with a compact top navigation, cleaner WordPress admin page spacing, and suppressed third-party notices on the plugin screen.
- Improved debug log readability with structured timeline rows, stack trace formatting, database call-chain formatting, safer text rendering, and cleaner expand/collapse behavior.
- Refined Safe Mode, Notifications, Terminal, Terminal Settings, and Overview screens for a more consistent settings-page experience.
- Fixed missing terminal settings routes, unresolved PrimeVue component registrations, Safe Mode submit state handling, admin-bar debug toggle styling, modal z-index, loader sizing, and empty feature icons.
2.0.1
- Fix typo
- Fix memory issue
2.0.0
- Added WP-CLI style command structure in terminal (e.g.,
wp core version) - Added database commands with WP-CLI syntax (
wp db query,wp db tables, etc.) - Added terminal settings page to enable/disable terminal and database features
- Added super admin restriction for database commands
- Added support for SQL queries with proper security measures
- Added stack trace visualization for better error analysis
- Help command to show commands by category with organized sections
- Enhanced security for terminal commands (preventing SQL injection, restricting destructive commands)
- Quick Debug Toggle from admin bar (WP_DEBUG)
1.5.3
- Fix footer text on all page
1.5.2
- Added query logs
1.5
- Fixed Vulnerability of debug log file. Generating random file for debug.
- Added a new safe mode which will turn off all plugins excluding selected ones.
1.4.5
- Fixed refresh
1.4.2
- New Constants
- Removed database dependency
1.4.4
- Fixed Refresh Log
- Added dashboard widget
- Clean UI
- Refresh Log
- Email Notification
1.0.0
- Initial Version